

![meta-platforms-inc.(meta)-elliott-wave-technical-analysis-[video]](https://traderstarter.com/wp-content/uploads/2024/05/14535-meta-platforms-inc-meta-elliott-wave-technical-analysis-video-1536x1130.jpg)
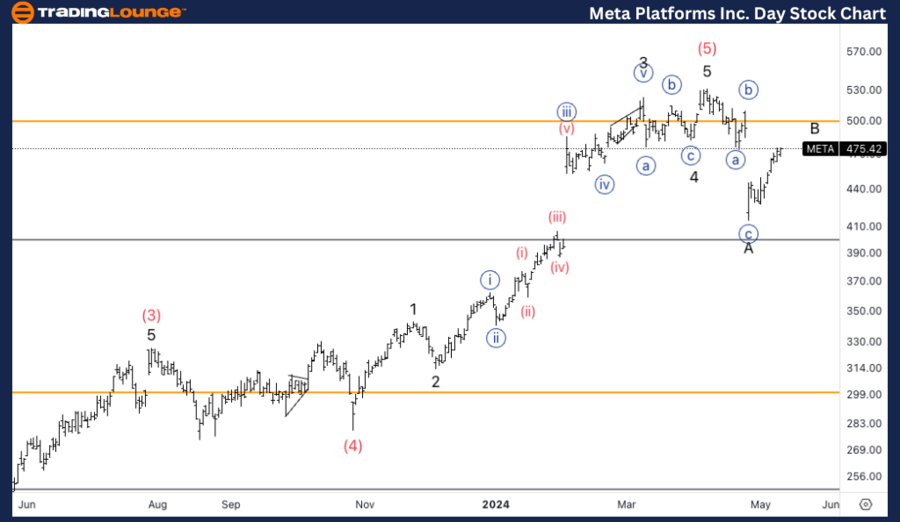
Meta Platforms Inc., (META) Daily Chart
META Elliott Wave technical analysis
Function: CounterTrend.
Mode: Corrective.
Structure: Flat.
Position: Intermediate (A).
Direction: Pullback in Minor B.
Details: We are showing two different counts in the Daily and 4H chart. Here we have a major top in place and we are looking for a larger correction to take place, looking for 500$ to provide resistance.
META Elliott Wave technical analysis – Daily chart
On the daily chart, META is categorized under a counter trend with a corrective flat structure, currently in the Intermediate wave (A) phase. The focus is on a significant pullback in the Minor B wave, suggesting a broader market correction. The analysis indicates a major top already in place, with a downward trajectory expected to continue. A resistance level at $500 is anticipated, which might cap any potential upside and confirm the bearish outlook.
META Elliott Wave technical analysis – Four-hour chart
The 4-hour chart presents a more micro view, still within a counter trend but focusing on the smaller corrections within the overall structure. It is in the phase of Wave B or possibly in Wave (4), with a current top formation in Wave B. The equality between Wave (2) and Wave (4) is calculated to halt at $450, suggesting a shorter corrective phase than what is noted on the daily chart.
Function: Counter Trend.
Mode: Corrective.
Structure: Flat.
Position: Wave B or (4).
Direction: Topping in wave B.
Details: Here we are looking at a smaller correction, we have measured wave (2) and equality of (4) and (2) stop at 450$. Looking for sideways consolidation in (4) or else we could already have a bottom in place.
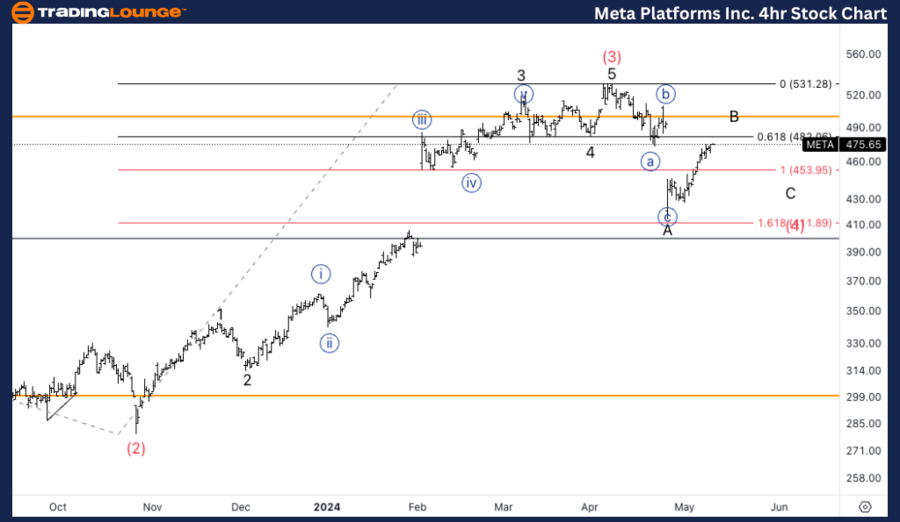
The Elliott Wave analysis for Meta Platforms Inc. (META) reveals a discrepancy between the daily and 4-hour chart interpretations as of May 10, 2024. Each chart provides a different perspective on the expected stock movements, catering to different trading strategies.
META Elliott Wave technical analysis [Video]
As with any investment opportunity there is a risk of making losses on investments that Trading Lounge expresses opinions on.
Historical results are no guarantee of future returns. Some investments are inherently riskier than others. At worst, you could lose your entire investment. TradingLounge™ uses a range of technical analysis tools, software and basic fundamental analysis as well as economic forecasts aimed at minimizing the potential for loss.
The advice we provide through our TradingLounge™ websites and our TradingLounge™ Membership has been prepared without considering your objectives, financial situation or needs. Reliance on such advice, information or data is at your own risk. The decision to trade and the method of trading is for you alone to decide. This information is of a general nature only, so you should, before acting upon any of the information or advice provided by us, consider the appropriateness of the advice considering your own objectives, financial situation or needs. Therefore, you should consult your financial advisor or accountant to determine whether trading in securities and derivatives products is appropriate for you considering your financial circumstances.