


- The trading volume of Cardano crypto has witnessed a decline.
- ADA crypto has a high supply inflation rate of 5.44%.
Cardano, created by Ethereum co-founders Charles Hoskinson and Jeremy Wood, is a Proof-of-Stake blockchain with smart contract capabilities.
Its ADA token is used for transaction fees, governance, and staking rewards. Cardano aims for sustainability and scalability, with ongoing development led by three organizations and a community-driven roadmap through eras.

The price of Cardano crypto has traded flat over the last seven days, resulting in a slight advance of 0.1%.
Also, the current market cap value of Cardano Crypto is $16.507B, and it is the 10th largest cryptocurrency in the global cryptocurrency market. The crypto’s market cap has advanced by 2.3% in the previous 24 hours.
The value of the traded volume for Cardano crypto has further declined by 48% against the advance in market cap. It has resulted in a traded value of $273.751M.
The following data results in a volume/market cap ratio of 1.66%, while the decline in volume shows weakness in the trend of crypto
Cardano Crypto Derivatives Analysis
When writing, the options volume, derivatives volume, and spot volume have declined in the past 24 hours. Despite this, the open interest has seen a slight advance of 0.36%.
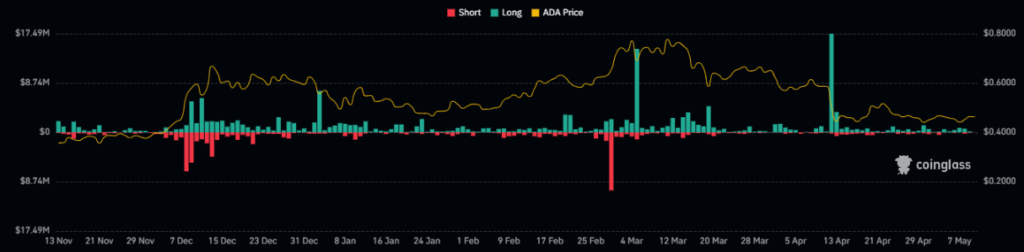
The liquidations further show strength in the crypto’s trading price, as the crypto’s short liquidation is much higher than the long liquidation.
Moreover, the recorded long liquidation for the Cardano in the last 24 hours is worth $16.61K, while the short liquidation for the crypto was $91.55K. It showed a higher profit booking in the crypto price.
The ADA Crypto Price Shows Uncertainty on the Technical Chart
Since October 2023, ADA crypto has embarked on a robust uptrend, reaching a peak of $0.8102. However, profit booking ensued, leading to a decline. This uptrend formed a rising wedge pattern, which subsequently broke down.
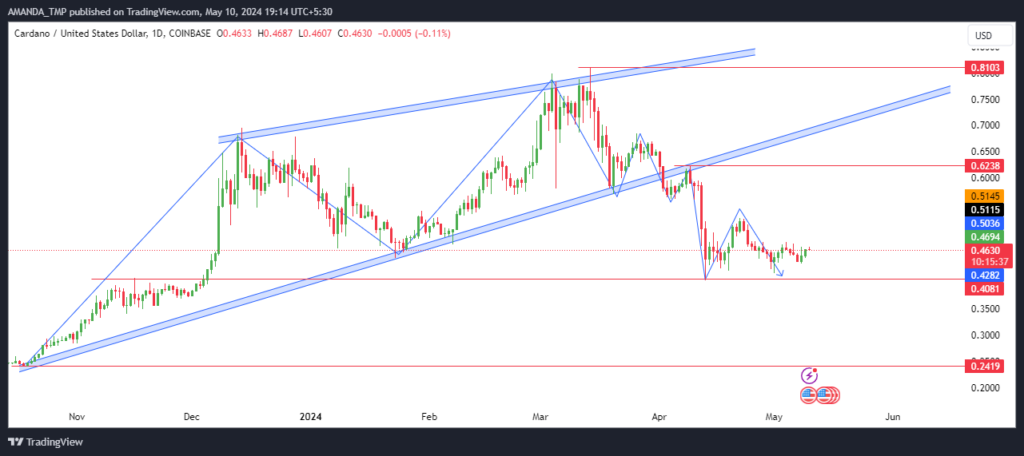
After facing resistance at the 200-day and the 20-day EMAs, the ADA crypto price continued to decline to lower levels.
Additionally, the 20 and the 200-day EMAs have formed a bearish cross. During the 50 days, EMA also fell towards the lower levels on the daily crypto chart.
ADA/USD Chart by TradingView
The MACD indicator reflected price uncertainty, with its metrics residing in negative territory. Although the MACD line surpassed the signal line, indicative of bullish sentiment, the overall assessment suggested weakness in the price trajectory.
On the daily chart of ADA crypto, the Relative Strength Index (RSI) has exhibited a persistent downtrend from elevated levels, reaching oversold territory. This pattern in the oscillator underscored significant selling pressure and sellers’ dominance.
Summary
Despite Cardano’s smart contract capabilities and a strong team led by co-founder Charles Hoskinson, the ADA crypto traded flat with declining volume. That indicated weakness at press time.
Technical analysis revealed resistance at EMAs, and bearish MACD and RSI indicators suggested further downward pressure. The high supply inflation rate added to the uncertain outlook.
If the ADA crypto price continues to decline, it might witness some buying pressure at $0.240 and $0.4080.
Moreover, on the higher side, the resistance levels for the ADA crypto are at $0.620 and $0.810.
Disclaimer
This article is for informational purposes only and does not provide any financial, investment, or other advice. The author or any people mentioned in this article are not responsible for any financial loss that may occur from investing in or trading. Please do your research before making any financial decisions.