

14h30 ▪ 10 min of reading ▪ by Thomas A.
Bull markets in cryptocurrencies generally benefit altcoins in a second phase. In the month of May, Ethereum (ETH) performed over 15%, and nearly 65% since the beginning of the year. This resurgence of Ethereum comes after the SEC approved the establishment of ETFs on the world’s second-largest cryptocurrency. While the correlation between Bitcoin and Ethereum remains high, the cyclicity of Ethereum’s price seems to act with as much precision in the structure of this bull market. Decoding the indicators and the dynamics of Ethereum’s price.

Soon an ETF to boost the market?
As with Bitcoin (BTC), the U.S. Securities and Exchange Commission has approved the establishment of an ETF on Ethereum. Thus, this decision will allow major global managers to expand the cryptocurrency offerings to their clients. However, the SEC still needs to approve its commercialization…
“This decision follows the successful introduction of Bitcoin ETFs in January, which quickly attracted $13.3 billion in net inflows, setting performance records for ETFs at their launch. The arrival of Ethereum ETFs could experience similar success, attracting a new influx of capital to the second-largest cryptocurrency.”
Crypto: Ethereum ETFs approved by the SEC! – Cointribune This same announcement for Bitcoin had particularly favored the price hike to historical highs. The arrival of an ETF on Ethereum thus leaves potential for a return to the November 2021 highs of $4,868. In May 2024, ETH thus represents nearly 17.7% of the market capitalization. This market share is still far behind Bitcoin, with a dominance near 53%.
The approval of Ethereum ETFs could thus instigate a catch-up effect compared to Bitcoin. Moreover, these ETFs could also be used to create ETFs representing a basket of cryptocurrencies in the future.
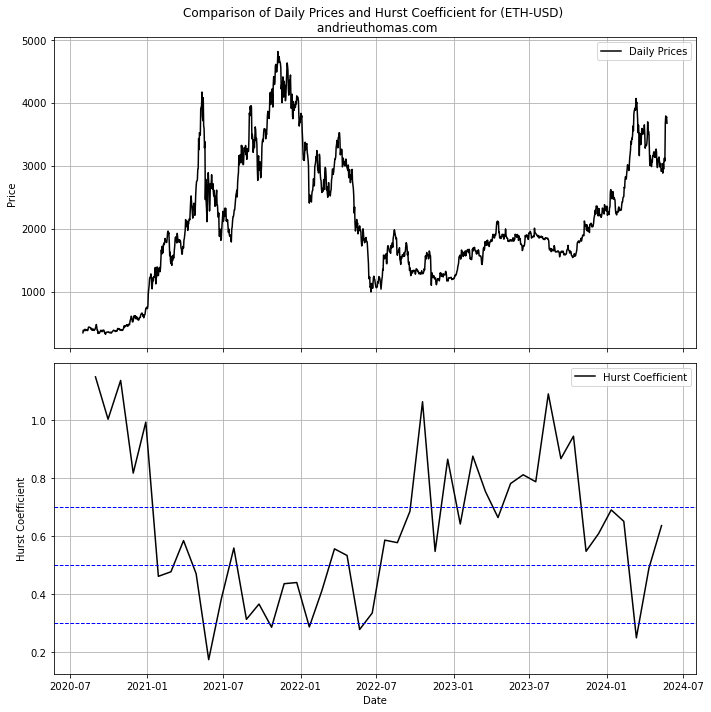
Taking a look at fractals: the rise persists
A major indicator for measuring the viability of the trend on ETH is to use fractals. Indeed, the Hurst exponent (read more) allows measuring the degree of trend persistence from one time scale to another. Furthermore, the Hurst exponent is ideally bounded between 0 and 1. With Ethereum, a Hurst exponent close to 1 indicates significant upward potential, and consequently a good symmetry with major lows. Conversely, a Hurst exponent close to 0 will indicate that the trend is anti-persistent and is likely to turn downward.