


Synopsis
Kadant (NYSE:KAI) is a global provider of engineered systems and technologies that facilitate sustainable industrial processing. KAI’s historical financial results have shown consistent consolidated revenue growth. In addition, its profitability margins were quite robust as well. For its most recent 1Q24 results, it continued to report top-line growth. Looking ahead, the growing ecommerce activity and its forecast growth through 2027 are expected to bolster KAI’s growth outlook. In addition, KAI also recently completed its acquisition of Dynamic Sealing Technologies, and this acquisition will enable KAI to expand its market reach. Therefore, I am recommending a buy rating for KAI, given its positive outlook.
Historical Financial Analysis
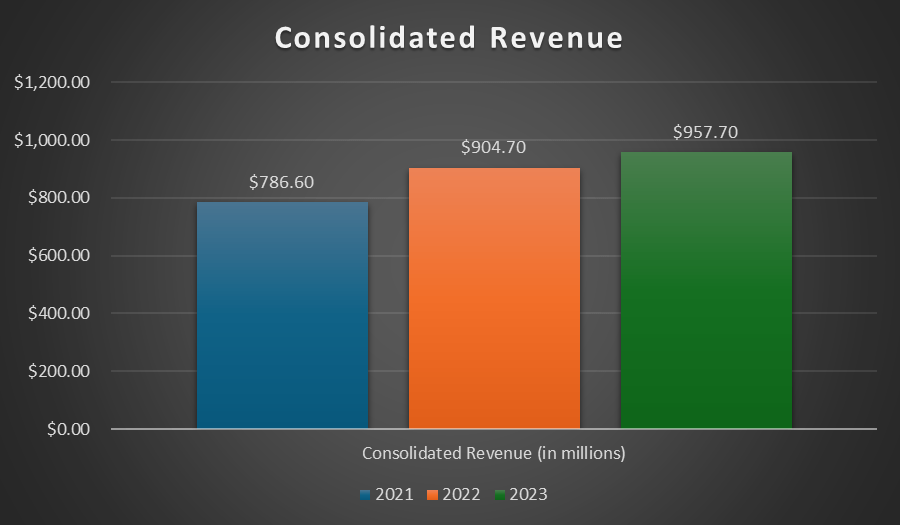
Over the last three years, KAI’s consolidated revenue has shown strong, consistent growth. In 2021, it reported consolidated revenue of $786.6 million. In 2022, consolidated revenue grew to $904.7 million, which represents a year-over-year increase of 15%. This growth was driven by acquisitions, which contributed 5%, and organic revenue growth, which contributed 15%, partially offset by the foreign currency impact of 5%.
Its revenue can be segmented into flow control, industrial processing, and materials handling. All three segments reported strong organic growth of 18%, 12%, and 15%, respectively. For flow control, it benefited from strong demand in the US packaging industry and from Europe, as end clients are trying to optimise energy utilisation due to high energy costs. For industrial processing, it was driven mainly by high demand in the wood processing business. Lastly, materials handling benefited from strong demand in North American vibratory and conveying business.
In 2023, consolidated revenue increased to $957.7 million, and all three segments continued to report organic growth. In 2023, most of its consolidated revenue growth was driven by its material handling segment, which reported year-over-year growth of 19%. This strong growth was due to increased demand for capital equipment products at its conveying and vibratory business in North America. The strong increase in demand was due to mineral mining project expansions. However, in 2023, KAI is also starting to see softening demand in China.
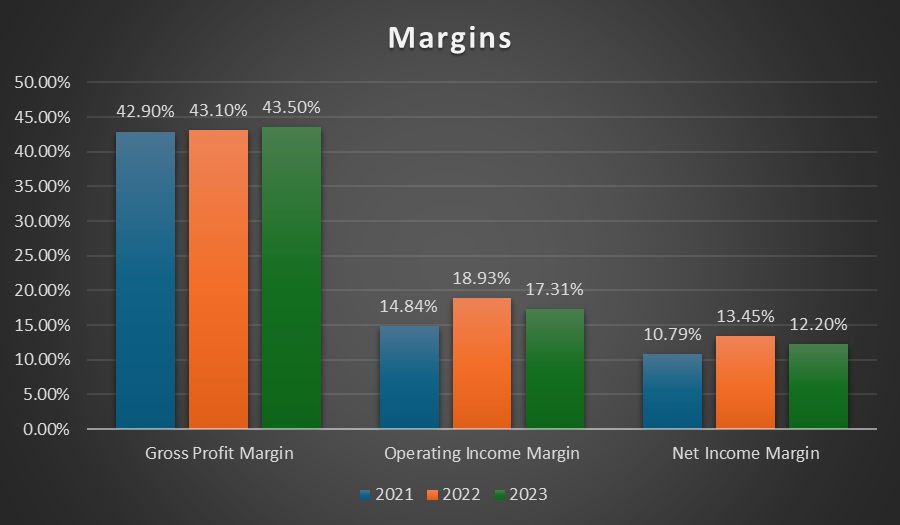
In terms of profit margins, KAI’s gross profit margin has been consistently expanding over the last three years. In 2021, the gross profit margin reported was 42.90%. It expanded to 43.10% in 2022 and 43.50% in 2023. The gross profit margin expansion in 2023 was attributed to higher profit margins on its parts and consumable products, as well as capital equipment products.
In 2022, KAI’s operating income margin expanded from 14.84% to 18.93%. This margin expansion was driven by lower selling, general and administrative [SG&A] and research and development [R&D] expenses. In 2022, SG&A as a percentage of consolidated revenue fell from 26.5% to 24.8%. R&D as a percentage of consolidated revenue contracted from 1.45% to 1.41%. KAI’s net income margin in 2022 also expanded, from 10.79% to 13.45%.
In 2023, although SG&A and R&D expenses as a percentage of consolidated revenue were in line with 2022, KAI’s operating income margin contracted slightly to 17.31% while its net income margin contracted to 12.20%. The reason behind this is that 2022 recorded a gain on sale and other items of $18.8 million arising from the sales of manufacturing buildings and land rights to local governments in China.
First Quarter 2024 Earnings Analysis
For KAI’s 1Q24 earnings results, its consolidated revenue increased 8% year-over-year to $248.9 million. However, its organic revenue fell 3% year-over-year due to softening demand in Europe and China. In these two regions, demand weakness was caused by weak macroeconomic conditions.
For the quarter, flow control segment revenue fell 3% due to demand weakness in Europe and China, as mentioned above. The decrease in flow control revenue was partially offset by higher demand in North America, driven by the strength of the US economy. Its material handling segment revenue was flat year-over-year.
On the other hand, industrial processing segment revenue increased 27% year-over-year. Organically, revenue increased 7%, attributable to higher demand for capital equipment products, particularly at its stock-preparation business in China. In addition, KAI also reported strong demand in its wood processing businesses in North America, driven by a resilient U.S. economy and housing market.
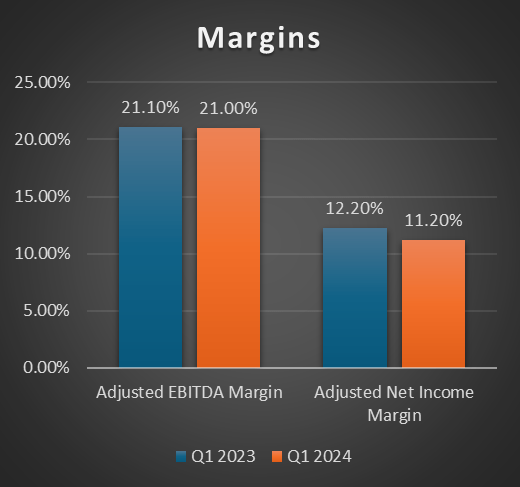
Moving onto margins, KAI’s adjusted EBITDA increased 8% year-over-year to $52.2 million. This translates into an adjusted EBITDA margin of 21%, which is pretty much in line with the previous period’s adjusted EBITDA margin of 21.1%. Regarding adjusted EPS, it fell by $0.02 to $2.38. The adjusted EPS decrease was caused by higher operating and interest expenses, lower organic revenue, and a slightly higher weighted average share outstanding. For the quarter, KAI’s adjusted net income margin fell by 1% to 11.20%.
Growing Ecommerce Activities Driving Packaging Demand
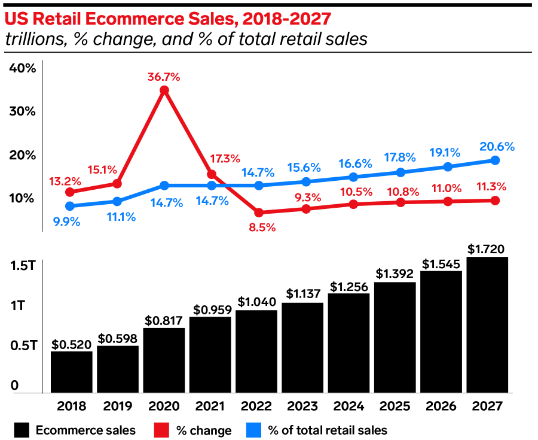
According to the Emarketer US ecommerce forecast for 2023, US retail ecommerce sales are forecast to continue growing until 2027. Since 2018, US retail ecommerce sales have been consistently growing. In addition, US retail ecommerce sales as a percentage of total retail sales have been consistently growing as well. This shows an ongoing shift in consumer behaviour towards online shopping. It also shows the demand and strength of ecommerce in general.
In 2018, ecommerce sales were approximately $520 billion. By 2023, ecommerce sales increased to approximately $1.137 trillion. These figures represent a percentage change of 118.65% or a compound annual growth rate [CAGR] of 16.94%. In 2018, US retail ecommerce sales as a percentage of total retail sales reported was 9.9%. By 2023, it had increased to 15.6%.
For the next four years, meaning 2024–2027, it is forecast that ecommerce sales will continue to grow and will grow at a double-digit percentage. For 2024, ecommerce sales are projected to reach $1.256 trillion, and by 2027, they are expected to reach $1.72 trillion. This represents a percentage change of 36.94%, or a CAGR of 11.04%. Additionally, US retail ecommerce sales as a percentage of total retail sales for 2024 is forecast to be 16.6%, and this figure is expected to expand to more than 20% by 2027. Overall, the outlook for US ecommerce sales is looking strong.
The strong outlook for ecommerce sales is expected to increase demand for containerboard. For context, containerboard is used in the production of corrugated boxes, and these boxes are essential for shipping and delivering goods purchased online.
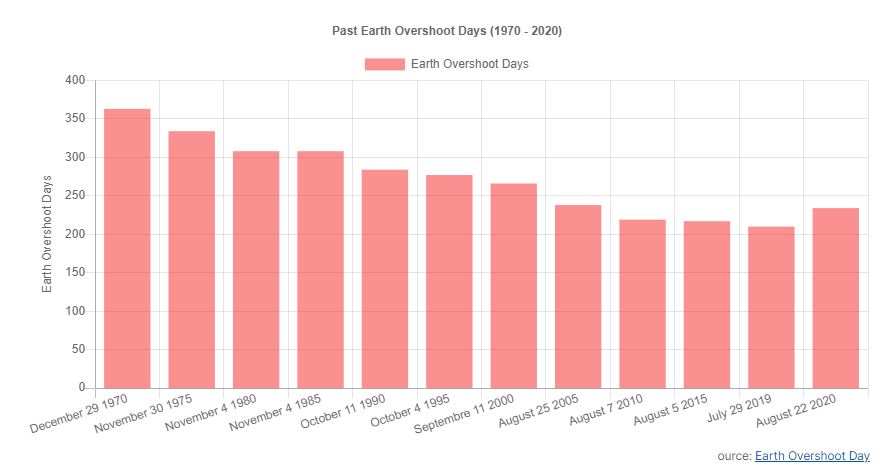
According to Nefab, global consumption of natural resources is almost double that of what Earth can produce in one year. When human resource consumption exceeds what Earth can generate in one year, Earth Overshoot Day marks that point in the year. Therefore, such practices are unsustainable, and the solution is to make a switch to sustainable materials. Therefore, in the current landscape of a circular economy, fibre-based packaging materials are becoming more relevant, and their role is also becoming increasingly important and significant. Therefore, this trend is expected to bolster KAI’s outlook, as KAI is a global provider of engineered systems and technologies that facilitate sustainable industrial processing.
Acquisition of Dynamic Sealing Technologies
On June 3, 2024, KAI announced the completion of its acquisition of Dynamic Sealing Technologies [DSTI]. The acquisition cost is $55 million and will be paid in cash. The cost is financed by KAI’s revolving credit facility. DSTI is a leading provider of engineered fluid sealing and transfer solutions for rotating applications. The following showcases DSTI’s primary product offerings.
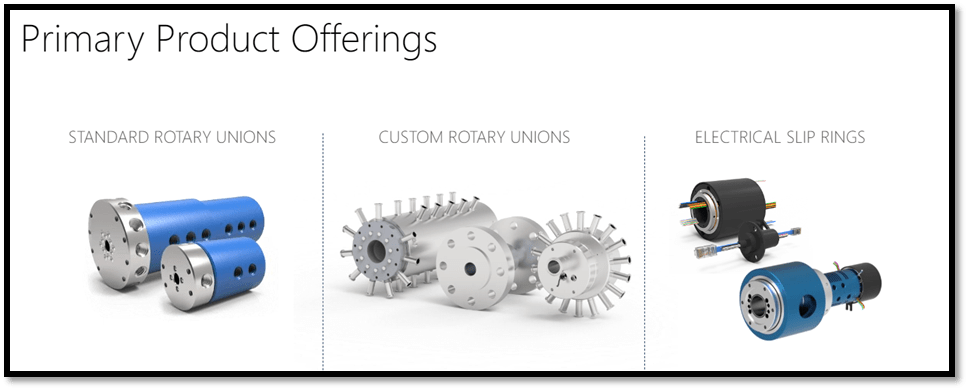
DSTI provides its services to clients in a variety of sectors, such as factory automation, energy, defence, and medical. Its last twelve months reported revenue was about $25 million. The acquisition of DSTI will be incorporated into KAI’s flow control segment.
The reason behind the acquisition is because DSTI has solid experience and expertise in flow control sealing technology. DSTI also has a strong market reputation, and its brands are well established in the market it operates in. As a result, it has a strong and long-standing relationship with its customer base. The other reason why DSTI was acquired is because DSTI’s product offerings highly complement KAI’s current offerings, thus enabling KAI to expand its market reach into adjacent industries.
For context, KAI’s flow control segment revenue as a percentage of 2023 revenue is approximately 38%, which in my opinion is considered quite significant. Its other two segments, industrial processing and material handling, account for 37% and 25%, respectively. From these statistics, KAI’s flow control segment forms the largest share of its total revenue.
Historically, KAI has demonstrated its expertise and experience in merger and acquisition [M&A] through a successful track record of M&As. For 2023, KAI’s adjusted average return on invested capital [ROIC] was approximately 15%. Therefore, given KAI’s experience in M&A and flow control accounting for the largest share of its revenue, I expect this acquisition of DSTI will bolster its growth outlook and contribute positively to its P&L.
Relative Valuation Model
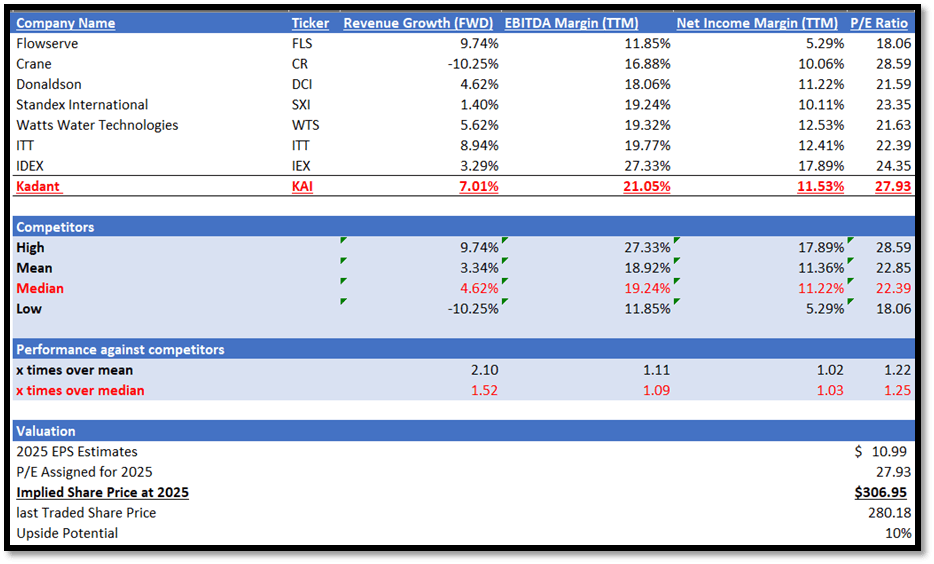
In my relative valuation model, I will be comparing KAI against its peers in terms of growth outlook and profitability margins. For growth outlook, I will be comparing their forward revenue growth rate, which is considered a forward-looking metric. For profitability margins, I will be comparing in terms of EBITDA margin TTM and net income margin TTM. EBITDA margin measures a company’s core business activity performance, while net income margin measures its overall profitability.
Starting with the growth outlook, KAI’s forward revenue growth rate outperformed its peers. KAI has a forward revenue growth rate of 7.01%, which is higher than peers’ median of 4.62%. This implies that KAI’s forward revenue growth rate is 1.52x over its peers’ median.
Regarding profitability margins, KAI outperformed in both EBITDA margin TTM and net income margin TTM. Firstly, KAI has a reported EBITDA margin TTM of 21.05%, while its peers’ median is 19.24%. Secondly, KAI’s net income margin TTM of 11.53% is also higher than its peers’ median of 11.22%.
Currently, KAI’s forward non-GAAP P/E ratio of 27.93x is higher than peers’ median of 22.39x. Given KAI’s outperformance in both forward revenue growth rate and profitability margins, I argue that it is fair for KAI to be trading at a higher P/E ratio. The higher P/E ratio reflects KAI’s stronger growth outlook as well as profitability.
For 2024, the market revenue estimate for KAI is $1.06 billion, while EPS is $10.03 per share. For 2025, revenue is estimated to reach $1.11 billion, while EPS is $10.99 per share. For FY2024, management has provided guidance in its most recent 1Q24 results. KAI expects revenue to be between $1.040 and $1.065 billion and adjusted EPS to be between $9.75 and $10.05 for FY2024. Based on management’s guidance as well as my forward-looking analysis as discussed, these data and growth catalysts support the market’s estimates. By applying my 2025 target P/E to KAI’s 2025 EPS estimate, my 2025 target price is approximately $306.
Risk and Conclusion
The downside risk associated with KAI is in relation to the oriented strand board [OSB] market. In general, the OSB market is highly concentrated and competitive, and there are only a few OSB manufacturers in the market.
As discussed, the industrial processing segment accounts for 37% of KAI’s consolidated revenue. In total, KAI’s two largest OSB customers account for 10% of its industrial processing segment revenues. Therefore, if KAI were to lose any of these customers, it could potentially hurt its financial performance.
In addition, wood panel products and their substitutes compete with the OSB market. Therefore, any changes in the pricing of these products will increase competition for OSB. This might lead to a reduction in capital spending or OSB production, and it will have a material impact on KAI’s financial performance.
Over the past few years, KAI has demonstrated consistent consolidated revenue growth and robust profitability margins. The growing ecommerce sales and its forecast growth until 2027 will bolster KAI’s growth outlook. In addition, its recent completion of its acquisition of DSTI will allow KAI to expand its market reach into adjacent industries, as DSTI’s product offerings highly complement KAI’s current offerings. Therefore, this acquisition is also expected to bolster KAI’s outlook. Given its positive growth outlook, I am recommending a buy rating for KAI.
Analyst’s Disclosure: I/we have no stock, option or similar derivative position in any of the companies mentioned, and no plans to initiate any such positions within the next 72 hours. I wrote this article myself, and it expresses my own opinions. I am not receiving compensation for it (other than from Seeking Alpha). I have no business relationship with any company whose stock is mentioned in this article.
Seeking Alpha’s Disclosure: Past performance is no guarantee of future results. No recommendation or advice is being given as to whether any investment is suitable for a particular investor. Any views or opinions expressed above may not reflect those of Seeking Alpha as a whole. Seeking Alpha is not a licensed securities dealer, broker or US investment adviser or investment bank. Our analysts are third party authors that include both professional investors and individual investors who may not be licensed or certified by any institute or regulatory body.